Overview of the capabilities of pandas_GUI

You can try this notebook live by lauching it in Binder.This can take a while to launch, be patient. Binder.

First get some data into a pandas dataframe. I'm using an IR spectrum of ethane because it was easy to get.

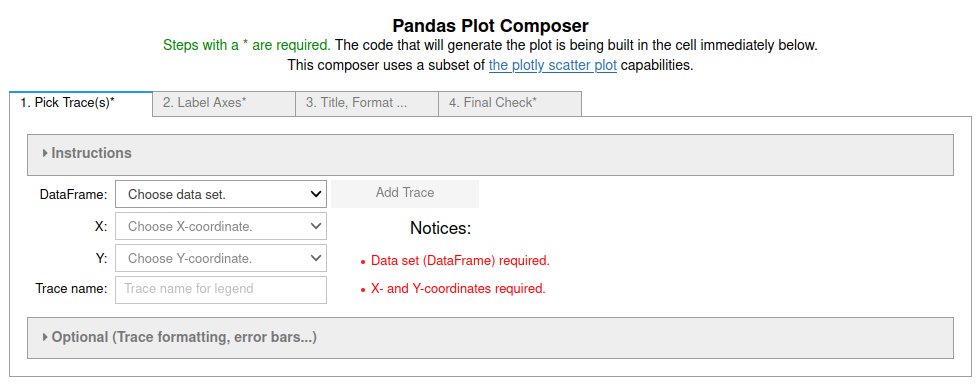
Let's use the plot_pandas_GUI() to make a plot of this. The simplest version of such a plot using defaults will look like this:

The cell used to create the GUI is deleted when it is done being used; thus the GUI will not show up in the final notebook. The commands necessary to create the GUI are:

from pandas_GUI import *
plot_pandas_GUI()

A static picture of the initial view of the GUI is:

Expand the instructions on each tab to help you understand how to use the GUI.

Many spectra are displayed as absorbance for the y-axis rather than transmittance, because absorbance is linearly proportional to the concentration of the absorbing species. The relation between absorbance and transmittance is: $$A = -log_{10}(T),$$ where A = the absorbance and T = the transmittance.

Putting the command new_pandas_column_GUI() in the cell below and running the cell will provide the GUI that can be used to add an absorbance column to the dataframe.

Just like the plotting GUI it deletes itself when done. A static image of the initial view of the new column GUI is shown immediately below:

The plot_pandas_GUI() can be run in the next cell to plot the absorbance or both absorbance and transmittance versus the '1/cm'. You might make a figure that looks like this:

There is also a GUI (the fit_pandas_GUI() command) that can be used to fit some common functional forms to a data set or portion of it. A static image of the initial view of the fit pandas GUI is shown immediately below:

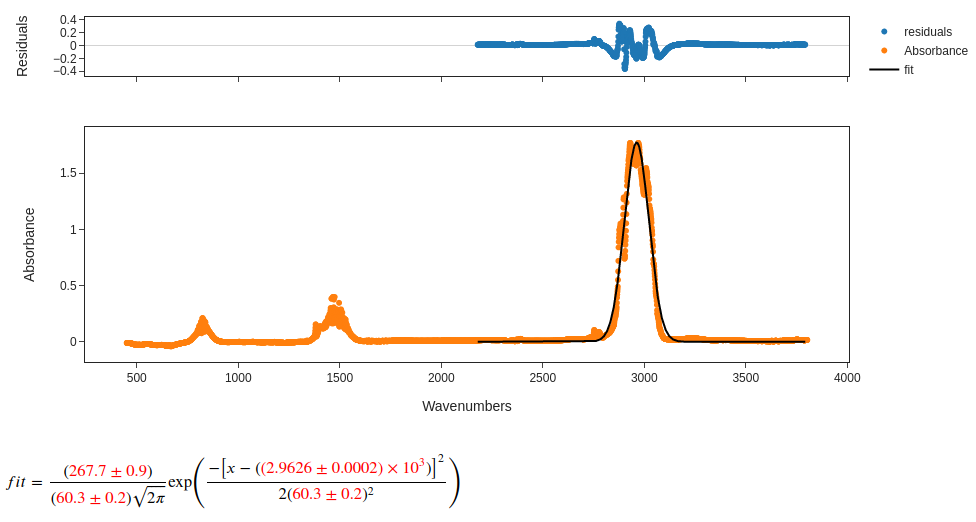
There are expandable instructions on each tab to help you use the GUI. You can try fitting the biggest peak in the absorbance version to a Gaussian by selecting a range to fit that only includes that peak. You need good initial guesses for the peak X-position at a minimum. Pick a value close to the middle of the peak. If you do that you will get a fit that looks like the one below.

Learn More

In addition to trying this in a live notebook, you can look at the other examples listed in the Pandas GUI website.