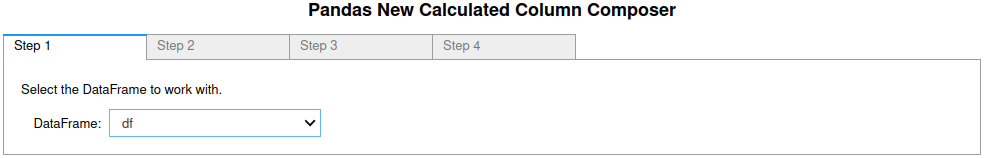
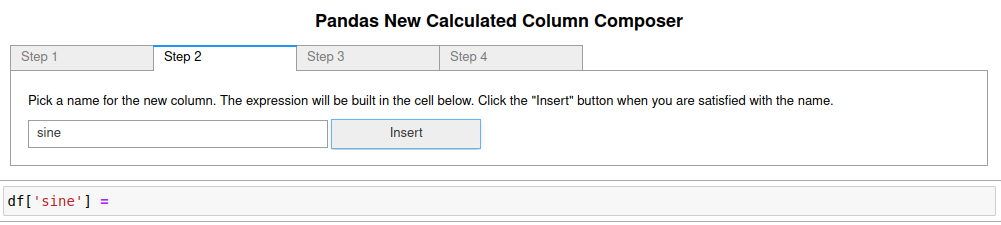
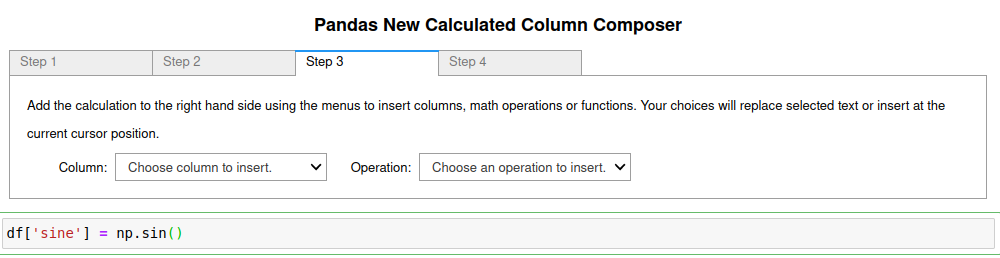
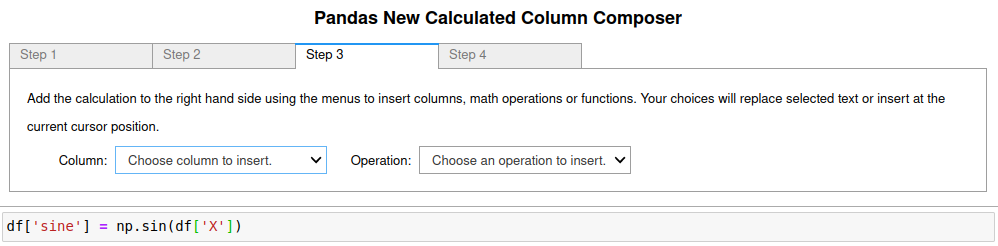
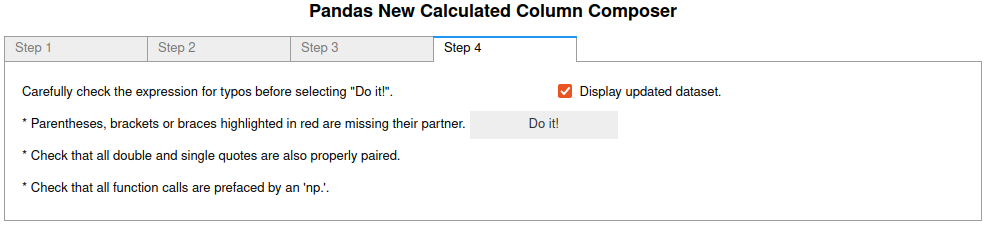
Creating a new calculated column using the new_pandas_column_GUI()

You can try this notebook live by lauching it in Binder.This can take a while to launch, be patient. Binder.

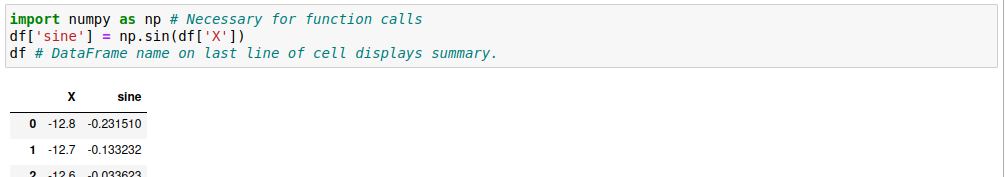
First we import pandas and pandas_GUI, and make a dataframe. In this case we will make an X column with numbers between -12.8 and +12.8.

Example : Make a column containing sin(X)

The steps below were done after running the command new_pandas_column_GUI() in an empty code cell. If you are running this notebook live you can try it yourself by running all the cells in the notebook. The last one runs the new_pandas_column_GUI() command, so will create a live GUI for you to try.

1. On the first tab

Which dataframe to add the column to was chosen as shown in the image below:

new column tab 1

2. On the second tab

A name is typed in the textbox for the new column and the insert button is clicked. This starts building the statement for creating the new column in the code cell immediately below the GUI as shown in the image below.

new column tab 2

On the third tab

There are two popup menus for selecting expression fragments to insert into the expression at the current cursor position.

  1. The image below shows what you see after selecting to insert sin() from the Operation popup.

New column tab 3 an operation inserted

The following options are available in the Operations popup: +, -, $*$, /, $**$, exp(), $log_{10}$, ln, sqrt(), sin, cos, tan, cot, asin, acos, atan, and acot.

  1. Then the Column popup was used to select the X column to insert into the sine function as the values it operates on. See the image below.

New column tab 3 a column inserted

On tab 4

The list of suggestions of things to check should be followed before clicking the "Do It!" button. If you do not want a table of the dataframe displayed uncheck that option. When "Do It!" is clicked any imports necessary to do the calculations will be added to the cell, the GUI will destroy itself and the cell to add the new column will be run. The image below is a snapshot of the fourth tab.

New column tab 4

The code created at the end is show below.

New column created code

A plot of the new column versus the X column created using the plot_pandas_GUI() (see plotting examples on the Pandas GUI website).

sine plot

Learn More

In addition to trying it below if this is a live notebook, you can look at the other examples listed in the Pandas GUI website.

Try It

If you are running this notebook live in binder you can try it here by running the first cell to import the tools and make the initial data column. Then run the cell below to create the GUI.